SCID vs. PC can do this.
Furthermore, it can do it in batch mode... for several games at once, (one game after another.) It can annotate and analyze for just one color, (side) or for both colors if you wish. You can, of course, use any engine you choose including Houdini.
See my tribute page to it below, which also gives the download link. One of the tips I give helps to describe how to do this. (After the analysis is done, you want TOOLS - SCOREGRAPH, I believe.)
http://www.edcollins.com/chess/scidvspc/index.html
Scid vs PC is just about the only GUI I now use. (I've never liked Arena.)
GUI to make analysis graph?
Sort:
Aug 31, 2012
0
#3
You can also do it in Arena, but only one game at a time, I think. (Go into automatic analysis mode.) If you need to do a batch mode for multiple games, or if you just like Scid vs. PC better, then obviously go with Ed's suggestion.
Okay, thank you, as this looks promising, but I've still not got it totally figured out.
First, I've downloaded Scid vs. PC 4.8, and I've opened a Fischer-Spassky pgn file in it, which allows me to navigate through the game. So far so good.
Yes, there is a Score Graph option under the tools command, and a help file that goes with it. The help file says that I first need to add scores to the game using the annotation feature.
Clicking on the help file link to the annotation feature, it tells me that I get this to work by clicking an icon in the analysis engine toolbar. Well, I don't know if it's a toolbar, but I can go to tools -> analysis engines, and find this icon.
But then, it tells me to configure the options and press okay. Here, I think I've gone wrong, because I don't see an 'okay' button. There is an 'auto' box to tick, and when I do this, the computer seemed to calculate something, but I don't know what. After a while, it just stopped. I get two output lines saying
Scid: stop
Scid: quit
Rebooting the program, I still get this. I haven't been able to find the annotations I was hoping for, and the graph remains blank. So, I seem to be a bit lost. Can you help?
Thank you
James
@EscherehcsE
Oh, interesting. I was firmly under the impression that Arena simply couldn't do this. I see now that when I open the automatic analysis dialog box, and tick a couple of boxes in the 'output' tab, it does indeed produce the graph, which can then be saved to the pgn file and opened later. Excellent, thank you!
Adrian_Kinnersley wrote:
Yes, there is a Score Graph option under the tools command, and a help file that goes with it. The help file says that I first need to add scores to the game using the annotation feature.
Yes, there is a Score Graph option under the tools command, and a help file that goes with it. The help file says that I first need to add scores to the game using the annotation feature.
Clicking on the help file link to the annotation feature, it tells me that I get this to work by clicking an icon in the analysis engine toolbar. Well, I don't know if it's a toolbar, but I can go to tools -> analysis engines, and find this icon.
But then, it tells me to configure the options and press okay. Here, I think I've gone wrong, because I don't see an 'okay' button. There is an 'auto' box to tick, and when I do this, the computer seemed to calculate something, but I don't know what. After a while, it just stopped. I get two output lines saying
Scid: stop
Scid: quit
Rebooting the program, I still get this. I haven't been able to find the annotations I was hoping for, and the graph remains blank. So, I seem to be a bit lost. Can you help?
Thank you
James
Hi James,
Glad to know you found what you were looking for using Arena. I'll address your Scid vs. PC issue, in case anyone else has that problem.
I'll assume you already set up an engine. (You will, of course, need to do this first.)
And yes, ScoreGraph under the TOOLS option won't show a graph at all, until it has a game that has been "scored." (Analyzed.)
Start your peferred engine and THEN click on that engine's annotate button, in the engine analysis window that popped up. (3rd icon from the right.) From there another window should appear called Configure Annoation, giving you a bunch of options on HOW you want your game annotated. (Just White, just Black, both sides, what the blunder threshold is, how long you want it to spend on each move, whether you want to annotate just his game in the pgn file or just the next game, etc.
From your description, it doesn't sound as if you got that far.
Also, you can see the annotations as they are being made. Click on the PGN window, if it's not already up, and watch the program make the moves and annotate the game before your eyes.
(When the game(s) are finished, note that you can also save all of this analysis, of course. Just export it to a new pgn file.
Also note that prior to doing this, as I recall, you should first drag your pgn file from the mainbase to the clipbase, and then click on the clipbase to make this the active database. Then you should begin the entire process.
Is there any way to use rybka 4 or fritz 13 to make the graph. I've been toying with the full analysis and the blundercheck and it is really irritating me that I can't see the graph analysis of how a game went. The sort of simple analysis and knowing right where the error occured and how it got worse from the graph in the sort of simple analysis you can have the computer generate on http://en.lichess.org/ is more helpful to me than looking at the score sheet output rybka generates with what I'm doing. If Rybka can't do this I'll probably end up analyzing games I play in rybka in different software which is all I can think of to do. Thanks for any advice.
Ron,
Rybka 4, as you know, is an engine. It's doesn't produce graphs. I'm not sure what GUI you're using, but you also mentioned Fritz 13. Fritz 13 is both an engine and the name of the GUI. And yes, the Fritz 13 GUI can produce evaluation graphs. Page 56 of the manual.
http://fritzload.com/download/pdf/ManualFritz13.pdf
Here's an example of an evaluation graph (called a score graph) from Scid vs. PC. This is the score graph of my 5th round game against Richard Skinnell this past Labor Day weekend, down in San Diego.
Producing this graph was incredibly easy. I first annotate the game, with Rybka or Stockfish or Houdini or whatever engine I wish, and then I click TOOLS - SCORE GRAPH and there it appears.
When I click any of the bars in this graph, I'm taken directly to that position in the game (In my other window, not shown here), which is kind of cool.
As you can see by this game, the position was relatively equal until Black played his 30th move, which was a blunder. After that White has a big edge for the rest of the game.
As I recall, WinBoard also produces simiar graphs, and according to the posts above, Arena does too.
An option allows the graph to look like this, which I don't prefer but maybe others do.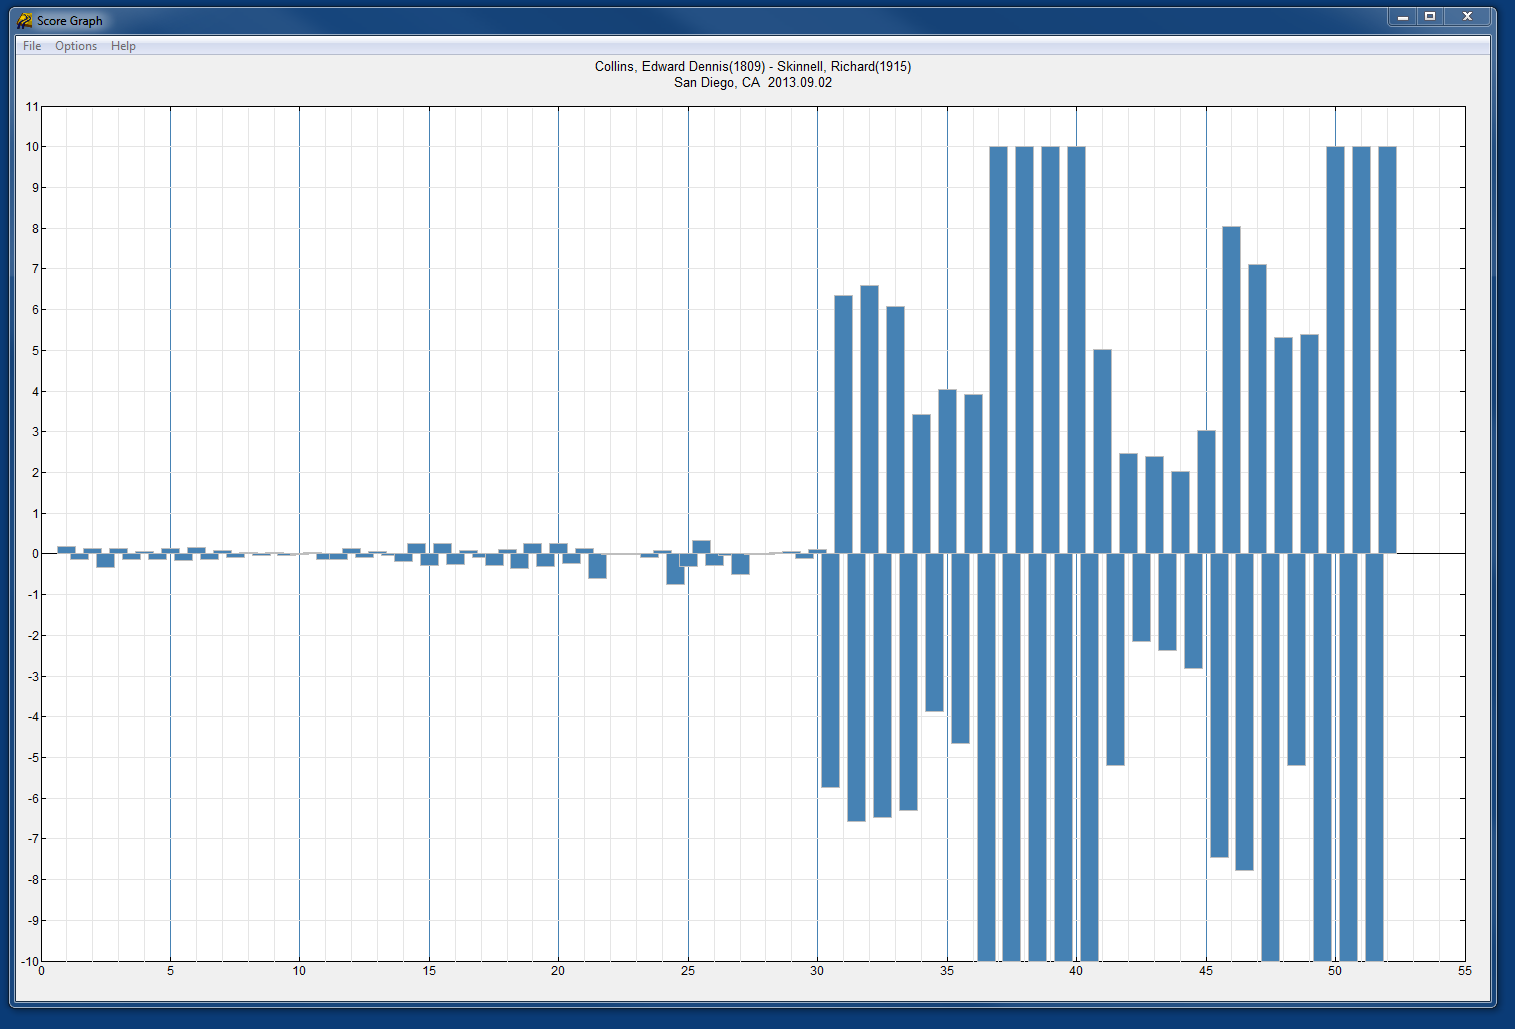
With this graph, the bars above the middle axis indicate White's advantage. The bars below that middle axis indicate Black's disadvantage.
Another comment:
Here's the annotated pgn file of the above game. (I'm copying only a portion of it.)
[Event "35th Annual Southern California Open"]
[Site "San Diego, CA"]
[Date "2013.09.02"]
[Round "5"]
[White "Collins, Edward Dennis"]
[Black "Skinnell, Richard"]
[Result "1-0"]
[WhiteUSCF "1809"]
[BlackUSCF "1915"]
[Annotator "Houdini 3 Pro x64"]
1.d4
{+0.19}
1...Nf6
{+0.13}
2.Nf3
{+0.14}
2...g6
{+0.34}
3.Bg5
{+0.14}
3...Bg7
{+0.14}
4.Nbd2
{+0.07}
4...d6
{+0.13}
5.e4
{+0.13}
5...O-O
{+0.17}
6.c3
{+0.15}
6...c5
{+0.14}
7.dxc5
{+0.09}
7...dxc5
{+0.09}
8.Qc2
{+0.03}
8...Nc6
{+0.05}
9.Be2
{+0.03}
9...Qc7
{+0.03}
10.O-O
{+0.02}
10...b6
{-0.03}
11.Rfe1
{-0.14}
11...Be6
{+0.14}
12.Rad1
{+0.12}
12...h6
{+0.09}
13.Bh4
{+0.06}
13...Nh5
{+0.05}
14.Bb5
{-0.18}
14...g5
{-0.26}
15.Bg3
{-0.28}
15...Nxg3
{-0.26}
16.hxg3
{-0.26}
16...Rad8
{-0.09}
17.Nf1
{-0.08}
17...Ne5
{+0.28}
18.Ne3
{+0.11}
18...Qb7
{+0.36}
19.Nxe5
{+0.25}
19...Bxe5
{+0.32}
20.Nf5
{+0.26}
20...Bg7
{+0.23}
21.Qe2
{+0.12}
21...Bxa2
{+0.60}
22.Ra1
{+0.00}
22...Be6
{+0.00}
23.Ra6
{+0.00}
23...Qc7
{+0.09}
24.Rea1
{+0.08}
24...Ra8 $201
{+0.76}
25.Nxg7 $6 $10
{-0.32 / +0.76}
( 25.Bc6 $14 )
25...Kxg7
{-0.32}
26.e5
{-0.29}
26...c4
{+0.03}
27.Qe4
{-0.50}
27...Rfc8
{+0.00}
28.Ba4
{+0.00}
28...Bd7
{-0.03}
29.Bc2
{+0.06}
29...Rh8
{+0.12}
30.Qd4 $201
{+0.10}
30...Bb5 $4 $18
{+5.74 / +0.10}
( 30...e6 31.Be4 Bb5 32.Rxb6 Qxb6 33.Qxb6 axb6 34.Rxa8 Rxa8 35.Bxa8 h5
36.Kf1 Kg6 37.Be4+ f5 38.exf6+ Kxf6 39.Ke2 Be8 40.Ke3 e5 41.Bd5 Bf7
42.Ke4 Bg6+ 43.Kf3 Bf7 44.Be4 Be6 45.Bc6 Bf5 46.Ke3 Bg6 47.Bd5 Bf7 48.
Ke4 $10 )
31.e6+
{+6.35}
31...f6
It would be trivial to write an Excel Visual Basic script (macro) to read in this text file and generate your own graph, and give it your own personal titles, colors, options, etc. (Assuming that's something someone wanted to do.)
Thanks Ed! That was helpful. The software I'm using is Rybka 4, I guess its sold now as a standalone product just like Fritz 13 and it uses the same GUI with the Office 2007 style ribbon which I find annoying. The evaluation profile graph this software generates shows only one move evaluations rather than a whole game and the scale of it changes as well which I find annoying. The help manual makes it clear it doesn't make a graph anything like what I want. What I want is to visually look at the graph of the game in a score like what you posted was done with Scid vs PC or preferably an even cleaner looking graph like lichess computer analysis of online played games does although that is really just a personal quirk on my part. For an expensive software bundle like Rybka I'm dismayed that it can't give you a graph that gives an overview of a whole games swings in one picture. You see, I've become accustomed to playing live opponents and then analyzing the games, loooking at the graph and going directly to the move with large swings in them to examine the blunders and what should have been played. Going through an annotation move by move makes the sort of review I like to do impossible if not simply much more time consuming. I've downloaded Scid vs PC and I like it. My impressions are that its simpler to use than Rybka/Fritz owing to the lack of a ribbon style interface. If it could play handicap games or at reduced strength I think I'd actually prefer it to the Chessbase product outright. As it is now I guess I'll play training games in Rybka/Fritz and save them a .pgn files to analyze with Scid vs PC.
I'll also download arena too. I see that it has a whole boatload of engines you can use to adjust its playing strength. I might like that. That's what I like about fritz is how adjustable strength. Thanks for your advice, I'm new to standalone chess software, at least the popular modern stuff. Previously I've only used Chessmaster 9000 until I got Rybka a month ago and find it to almost be more hassle than its worth. It's two redeeming features as I see it are its database managment and its handicap and fun levels.
I guess I could write an excel macro to make a graph evaluation but I won't bother. In college I had to use excel to do accounting ledgers and financial statements from their inputs and it was just linking cells and stuff but it was years ago. I'd probably mess it up 8 or ten times before I got it right, I haven't been an everyday excel user for a couple years and when I was I never had to write a macro except in school.
Best regards. 
Sep 15, 2013
0
#12
I really like how Arena does the evaluation graph, with one big exception. In automatic analysis, it won't evaluate the last two half-moves of a game...A very irritating bug. 
MrEdCollins wrote:
And yes, ScoreGraph under the TOOLS option won't show a graph at all, until it has a game that has been "scored." (Analyzed.)
Start your peferred engine and THEN click on that engine's annotate button, in the engine analysis window that popped up. (3rd icon from the right.)
Thanks for this comment! Just what I was searching for. The score graph looks great!
Hi everyone.
On some grandmaster tournament web sites, they show for each game a graph of the analysis (+ or - for white, and by how many points) as of each move of the game. I'm looking for software that can enable me to do this on my own. For example, I'd like to download a PGN from the 1972 Fischer-Spassky match, open it up in a GUI, and then let it run for a few minutes to produce this graph.
I already have Houdini, which gives good analysis. The only trouble I have is that the GUI I'm using is Arena, which only produces an entry on the graph when the computer itself is making a move, rather than what I want, which is a graph produced entirely from an existing game. I have to check the analysis by hand at every move to see what the score is, which can be a tedious way to identify the turning points. Are there other GUIs that I can use that will make this more easy? Preferably ones that can be used with Houdini, but that last part isn't necessary.